Fibonacci trading is the page dedicated to teach Fibonacci tools for day traders, though all our examples used here for illustration comes from equities listed in New York Stock Exchange; this technical tool can be used in any segment of stock market globally.
I take this page "Fibonacci-trader" for active training based on Fibonacci patterns as and when they arises in stocks (NYSE) in day trading. I also take this opportunity to explore to the stocks listed in various sectors and industries, i would also post recommendations for the next trading day based on Fibonacci tools.
Fibonacci numbers
Fibonacci numbers were developed by Leonardo Fibonacci and it is simply a series of numbers that when you add the previous numbers you come up with the next number in the sequence. Here is an example:
1, 2, 3, 5, 8, 13, 21, 34, 55
See how when you add 1 and 2 you get 3? Now add 2 and 3 and you get 5, and so on. So how does this sequence help you as a swing trader?
Well, the relationship between these numbers is what gives us the common Fibonacci retracement pattern in technical analysis.
Fibonacci tools
Some of the important Fibonacci tools available for technical analysis:
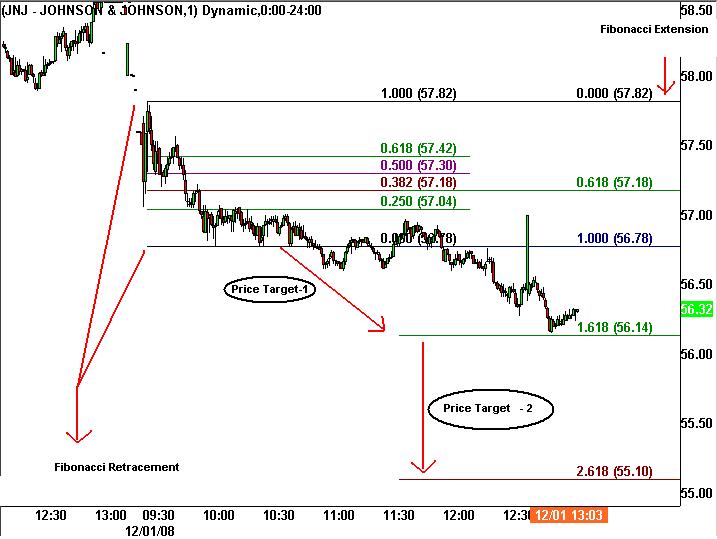
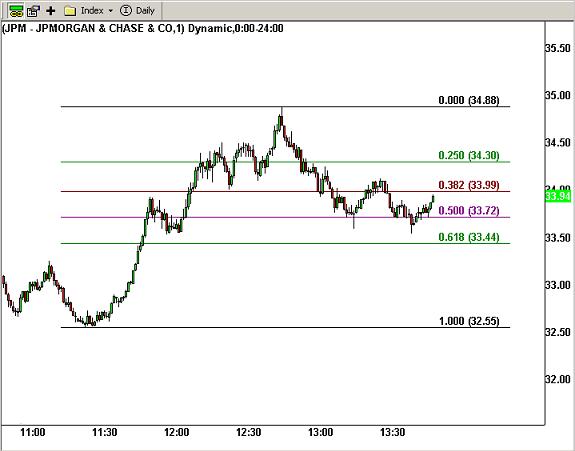
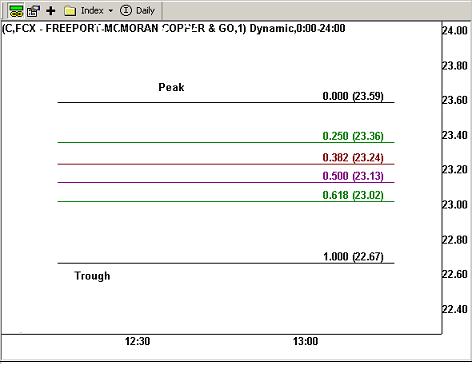
- Fibonacci Retracement
- Fibonacci Extension
- Fibonacci Time
- Fibonacci Circle
- Fibonacci Channel
The blog "Fibonacci-Trader" would closely concentrate on the top 2 Fibonacci tools:
- Fibonacci Retracement
- Fibonacci Extension